The Best Metro Areas for Commuting by Car

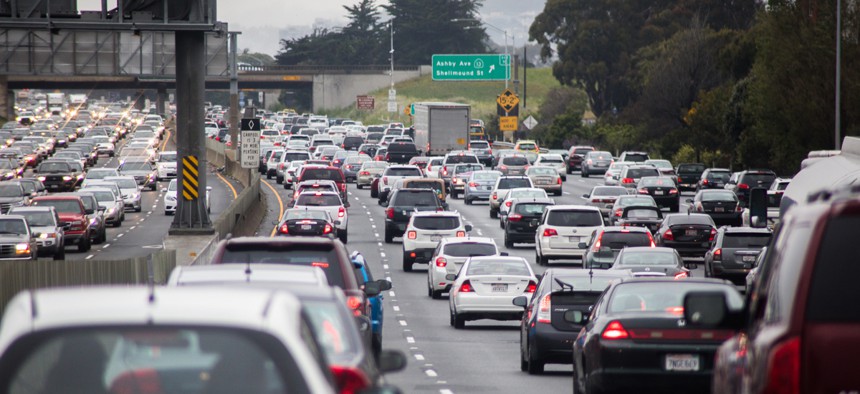
Larger cities typically have more congestion, but other factors come into play, the report says. shutterstock
New research from the University of Minnesota ranks major metro areas on job accessibility by car and the effects of congestion.
New York City, Los Angeles and Dallas are among the metro areas with the best car access to jobs.
But New York and L.A. both also suffer from notable traffic congestion—as do cities as diverse as Boston, Washington D.C. and Atlanta—which effectively reduces the job accessibility of those regions.
That’s according to the Access Across America study, an annual report from the Accessibility Observatory at the University of Minnesota. The rankings, which began in 2013, examine both land use and transportation systems to determine how many destinations, including jobs, can be reached in a given time. The latest report, released this month, is based on data from 2017 and ranks both access to jobs by car and the effects that congestion has on accessibility in the nation’s 50 largest metro areas.
“There are a variety of ways to define accessibility, but the number of destinations reachable within a given travel time is the most comprehensible and transparent—as well as the most directly comparable across cities,” the report says. “Jobs are the most significant non-home destination, and job accessibility is an important consideration in the attractiveness and usefulness of a place or area.”
Automotive transport—by car, truck and other private vehicles—is the most common commuting method nationally, accounting for an estimated 86 percent of trips, the report says.
To determine job accessibility by car, researchers calculated travel times using “detailed road network and speed data that reflect typical conditions for an 8 a.m. Wednesday morning departure” in major metro areas. Researchers then determined the number of jobs that can be reached in each area within a given travel time threshold, from 10 minutes to one hour.
Based on those metrics, the top 10 metro areas for job accessibility by car are New York, Los Angeles, Dallas, San Jose, California; Chicago, Houston, Minneapolis, Phoenix, Detroit and San Francisco.
In top-ranking New York, drivers can reach 93,672 jobs in a 10-minute ride; 479,756 in a 20-minute ride and nearly 5.2 million within an hour. (In tenth-ranking San Francisco, those numbers are 76,658, 295,256 and 2.4 million, respectively.)
Population size and density affects those rankings, but other factors come into play as well, researchers wrote.
“Key factors affecting the rankings for any metro area include the number of jobs available and where they are located, the road network structure, traffic management practices, the provision of alternate transportation modes, and population size, density, and location,” the report says. “Better coordination of transportation systems with the location of jobs and housing will improve job accessibility by auto.”
To determine the effects of congestion on job accessibility, researchers calculated travel times for hourly departures from midnight to 11 p.m., then compared the best number to results from the 8 a.m. morning commute peak. The difference between the two times is “interpreted as the number of jobs that a traveler could reach (within a given travel time threshold) in free-flow conditions, but could not reach in congested conditions due to lower speeds,” and is expressed as a percentage.
For example, Boston residents experience a congestion impact of 57.16 percent at the 10-minute travel time, meaning that the average worker can reach 57 percent fewer jobs during congested periods than during times with no traffic.
Five of the metro areas that rank well for job accessibility by car are hampered by congestion: New York, Los Angeles, San Francisco, San Jose and Chicago. The other areas experiencing the highest loss because of traffic are Boston, Washington D.C., Atlanta, Miami and Riverside, California.
“Rather than focusing on how congestion affects individual travelers, our approach quantifies the overall impact that congestion has on the potential for interaction within urban areas,” Andrew Owen, director of the Observatory, said in a statement.
Larger and more densely populated hubs typically have more congestion than smaller cities, the report notes, but “variation in the arrangement of land uses, road network structure, traffic management practices, and the provision of alternate transportation modes allows individual cities to experience greater or lesser congestion impacts than their size would predict.”
For example, Boston ranks 16th for job accessibility by auto but clocks in sixth for congestion impacts. That’s likely due to geography, the report notes, as Boston’s central business district is accessible mostly by bridges and tunnels with limited capacity. By contrast, Dallas ranks third for job accessibility but 15th by congestion impact.
“This is not to suggest that drivers in Dallas do not experience congestion—only that other factors, such as zoning, highway capacity, and other land use issues, play a relatively larger role in determining job accessibility,” the report says.
The results can be utilized by state and local governments in a variety of ways, including evaluating performance goals and prioritizing projects and investments, the researchers note.
“In constantly evolving systems like these, it is also critical to monitor changes over time,” the report concludes. “A city that adopts a goal of increasing accessibility by auto should be evaluated based on how effectively it advanced that goal relative to a baseline.”
Kate Elizabeth Queram is a Staff Correspondent for Government Executive’s Route Fifty and is based in Washington, D.C.
NEXT STORY: How One State Decided to Scrap Licenses For Horse Massage Therapists


