How to Convince Homeowners to Relocate Because of Climate Change

djjohn/Getty Images
One expert says the path to success may lie not in the data itself, but in how governments communicate the data.
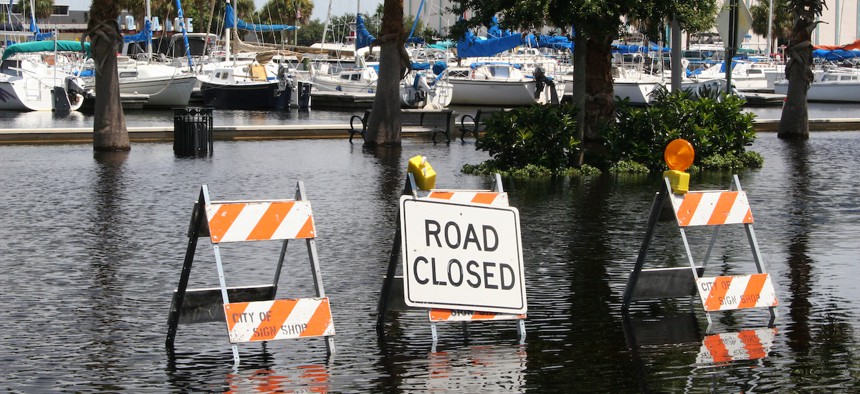
Rising sea levels and eroding shorelines are threatening communities on the East and West Coasts, experts warn, which may force residents to relocate to higher ground.
Half Moon Bay, California, for example, is facing a crumbling beachfront as a result of storm damage, but the local residents are putting up a fight to stay. According to Grist, wealthy local residents have taken the California Coastal Commission to court on multiple occasions to stop its plan to limit coastal development and relocate their homes.
It’s natural for people to be attached to their homes, and many are skeptical of data predicting rising sea levels and increasingly severe storm surges. Even if homeowners wanted to move, they may struggle to find comparable housing elsewhere, according to A.R. Siders, an assistant professor at the University of Delaware’s Biden School of Public Policy and Administration, whose research focuses on climate change adaptation policies.
So how can officials convince residents whose homes are endangered by flooding to uproot their lives and move inland?
“Sometimes it’s less about the data, and it’s more about how we communicate the data,” Siders said. For instance, the 100-year flood principle, which is often used to determine if a household requires flood insurance, asserts that a given area has a 1% chance of flooding annually. “The other way to think about that is … you have a 1 in 4 chance of your home flooding during the course of a mortgage,” she said.
“Those different ways of saying, ‘This is a 100-year storm, this is a 1% annual chance, this is a 1 in 4 chance,’ all describe exactly the same thing,” she said. “But they make people think about it differently.”
To help translate complex ideas like flood risk to a community, Siders advised using data to tell a story. That means leveraging tools that make data relevant to the audience. “If you just show a flat map on a table or a chart of the data … it’s not effective at convincing them that there’s actual risk.”
Instead, data visualizations should emphasize how climate-driven events will directly affect a community. For instance, if climate data shows sea levels rising by a foot in a neighborhood, data stewards might use an infographic depicting which roads would be under water as a result, Siders said. When residents realize that they not only would be cut off by regularly flooded streets but that emergency vehicles may be unable to quickly respond to a 911 call, the impact of the sea-level rise becomes personal and may prompt them to consider relocating.
Another way to present convincing data is to use more relevant time scales. For example, researchers may refer to the year 2100 when they describe the impacts of climate change, but that may be too abstract for average listeners—especially if they won’t be alive by then, Siders said. To get people on board with managed retreat, data stewards should consider presenting data closer to the present such as 2050. Using 30-year references could also help build the argument for managed retreat, as that is the timeline for most mortgages.
“If you want to talk to coastal property owners, let’s talk about insurance rates and risks to their homes,” Siders said. “If you bought a house today in this neighborhood, what would it look like by the time you finished paying your mortgage? As a homeowner, I would hope the [government] would have a plan.”
Ultimately, “the key is finding your audience, knowing what they care about and then using the data … in a way that makes it real for something they care about,” she said.


