The States and Metro Areas Where Poverty Was Highest Last Year

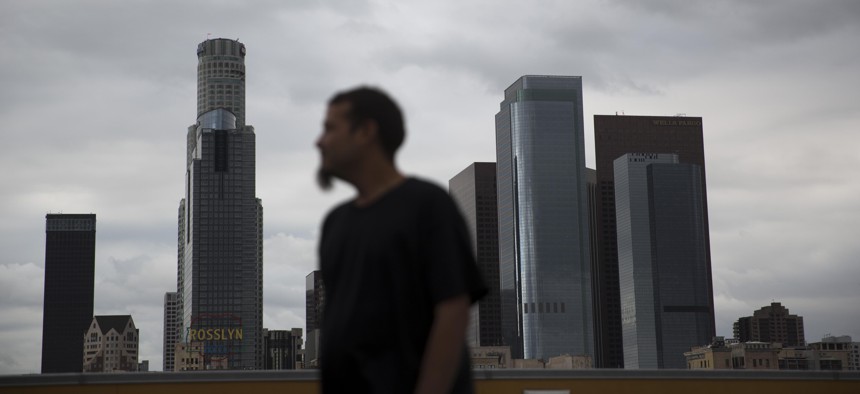
Homeless James Hernandez, a 27-year-old Houston, Texas native, looks away while watching his two daughters play on the rooftop of the Union Rescue Mission as the skyline of downtown Los Angeles is visible in the background, in May 2016.

Connecting state and local government leaders
New estimates from the U.S. Census Bureau offer a look at the states and metro areas that have been grappling with the nation’s highest poverty rates, as well as income inequality.
While the nation’s economy is running strong overall, U.S. Census Bureau figures released this week show that 10 states and the District of Columbia had poverty rates of 15 percent or above last year and that income gains continue to skew toward higher earners.
For the second year in a row, Mississippi was the state with the highest poverty rate. It checked in at 19.8 percent, according to 2017 American Community Survey figures released on Thursday. The state with the lowest rate last year, at 7.7 percent, was New Hampshire.
The national poverty rate figure for 2017 was 12.3 percent.
From 2016 to 2017 the poverty rate declined in 20 states as well as the District of Columbia, according to Ashley Edwards, a supervisory survey statistician with the Census Bureau.
“In 10 of these states, 2017 was the third consecutive year that poverty declined,” she added. “In five of those states it was the fourth.”
Delaware and West Virginia were the two states that saw poverty increase from 2016 to 2017.

Among the 50 most populous U.S. metro areas covered by the new data, poverty rates ranged from 7.3 percent in and around San Jose, California to 18.6 percent in the New Orleans region.
“Louisiana has struggled with poverty for a long time and continues to,” said Jan Moller, director of the liberal Louisiana Budget Project. The state “remains a very good place if you have a college degree, or if you're in oil and gas, or if you’re kind of in the economic elite.”
“But it remains a very tough place for a very significant percentage of our population,” he added.
The poverty rate estimate for last year for all of Louisiana was 19.7 percent, meaning about 899,000 of the roughly 4.5 million residents there lived in poverty. The figure is just shy of the state’s 2016 poverty rate of 20.2 percent.

In the metro area in and around San Antonio, Texas, the poverty rate was also high—14.5 percent. That figure includes about 351,000 of the area’s roughly 2.4 million residents.
San Antonio Mayor Ron Nirenberg said in an emailed statement that the statistic underscores the importance of his agenda.
He noted that his city budget features an “equity framework” designed to improve services in underserved parts of town. The mayor also highlighted recommendations the City Council recently approved from a housing task force, and efforts around mass transit.
"This is all part of an overall effort to address historic generational poverty that has gripped our city,” Nirenberg added.
The poverty threshold the Census Bureau uses for the survey varies based on family size and other factors. But for a family of three, with one child under 18, it would have been around $19,500 last year. If the family’s income is below that level, they’re considered to be in poverty.
On Wednesday, the Census Bureau released findings separate from the American Community Survey for what’s known as the Current Population Survey. This report included the official U.S. poverty rate for 2017 of 12.3 percent—down from 12.7 percent in 2016.
It also showed that median household income in the U.S. last year increased to $61,372 from $60,309 in 2016.
The median income figure for last year is “statistically tied” with two other high points for national income in past years, one in 1999, just before the burst of the so-called “dot-com bubble,” and another in 2007, the year the Great Recession hit, a Census Bureau official said.
But the rate of median income growth also slowed noticeably last year, rising at just 1.8 percent, compared to 3.1 percent in 2016 and 5.1 percent in 2015.
And while the economy is thriving right now according to a number of metrics, including a low unemployment rate that is around 3.9 percent, not everyone is reaping the same benefits.
For instance, analysis from the left-leaning Economic Policy Institute showed that cumulative gains in annual household income were about 9 percent between 2000 and 2017 for the top five percent of earners, a group that included those earning $237,034 last year.
In contrast, they found that earners in the median income group saw income decline by about 0.8 percent over that same time period.
“Most families have just barely made up for lost ground over the past decade,” Elise Gould, a senior economist with the institute said during a call with reporters.
Valerie Wilson, director of the Program on Race, Ethnicity and the Economy for EPI noted that “income growth has stalled among black households” and was essentially flat last year. Hispanic household income did not follow the same trend and grew by about 3.7 percent.
The American Community Survey release includes estimates for what’s known as the Gini Index, which is used as a measure of economic inequality. As measures on the index move closer to one, the gap between lower and higher earners widens.
For the entire U.S., the index measure for 2017 was 0.482.
States with index scores that were higher than the national figure included New York, Connecticut, Louisiana, California, and Florida, as well as the District of Columbia.
“We still have a lot of jobs that don’t allow families to make ends meet,” Moller, with the Louisiana Budget Project, said of his state. “There are still huge barriers to the middle class for many people.”
Bill Lucia is a Senior Reporter for Atlantic Media's Route Fifty and is based in Washington, D.C.

NEXT STORY: Can Ammo Control Curb 3D-Guns?


