Data map reveals local drivers of climate risks

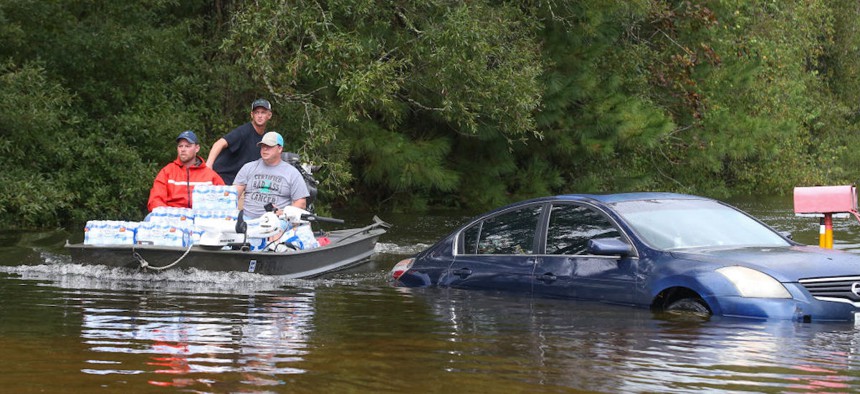
Rescue workers navigate flooded waters on Sept. 20, 2019, in Beaumont, Texas. Photo by Thomas B. Shea/Getty Images
The climate vulnerability index shows the intersection of increasing climate risks and long-term health, social, environmental and economic conditions so state and local officials can target the most effective solutions for their communities.
No community is safe from climate change’s effects. And understanding the impacts and drivers of those complex changes can be challenging for state and local governments with limited resources and staff. Without data on how climate change impacts their communities, it can be difficult for policymakers to implement effective solutions. To help ease the process, researchers developed a new web-based tool that provides hard data on local climate risks to help inform policy or funding decisions aimed at increasing climate resilience.
Developed by Texas A&M University, the Environmental Defense Fund and Darkhorse Analytics, the climate vulnerability index maps details from 184 datasets across 70,000 census tracts. It displays a range of community vulnerability data, such as health, socioeconomic, environment and infrastructure conditions and identifies existing burdens like limited access to health care or unfair housing practices that affect a community’s climate resilience. The map also features data on climate change impacts, such as the number of heat-related deaths or the frequency and severity of wildfires in an area.
With the site’s combined community vulnerability and climate risk data, state and local officials can better grasp the specific drivers of local climate vulnerability, said tool co-developer Weihsueh Chiu, a professor at the Texas A&M School of Veterinary Medicine and Biomedical Sciences.
Previous data resources aimed at helping communities understand their climate change risk may fall short because they simply locate vulnerable areas without showing what factors contribute to those weak conditions. The climate vulnerability index, however, helps state and local officials identify “the most important sources creating those vulnerabilities … to help prioritize resources and decentralize solutions so communities can get the resources that are tailored to their particular challenges.”
Take Houston, Texas, for example. In recent years, the city has seen historic flooding following events like Tropical Storm Imelda in 2019, whose heavy rainfall led to the death of at least five people. Almost 2,000 vehicles in Harris County had to be towed from roadways, and the Interstate 10 San Jacinto Bridge, a major route used to get in and out of Houston, was damaged during the storm. Officials at the time said repairs could cost around $3 million.
Houston's vulnerability to flooding could be further exacerbated by poor infrastructure design and quality, Chiu said. In fact, the index also ranks Harris County’s road quality and maintenance in the highest vulnerability category, signaling to policymakers that infrastructure improvements are a critical issue to address. The detailed data in the climate vulnerability index could help Houston officials target specific funding opportunities that match both the community’s climate needs and make infrastructure more resilient, Chiu said.
Also in Harris County lies the Pleasantville neighborhood, which faces different climate-related challenges, said Cleophus Sharp, a board member of the nonprofit Achieving Community Tasks Successfully, or ACTS, which offers communities technical expertise and resources to achieve their goals. Sharp, who was involved with the tool’s development, says Pleasantville is susceptible to pollution from nearby factories and warehouses, and the index documents those claims. For instance, data shows many census tracts in the Pleasantville area are located within three miles of facilities that produce chemicals that “pose a significant human health risk,” according to the index.
The tool can help organizations like ACTS produce data to show how the development and placement of industry sites can contribute to Pleasantville’s climate vulnerability when they demonstrate adverse pollution and health outcomes in the area. For instance, Sharp recalled how living near a refinery led to a two-week hospital stay after contracting asthma from poor air quality conditions. Policymakers could leverage pollution and health data from the map to support investments in air quality monitors, he said, to reduce and prevent future climate and health risks.
“The core message of what [the tool] is trying to do is to be able to get place-centered solutions to those places and those needs,” Chiu said. In fact, users can also find a list of federal resources on the site, mostly current and upcoming funding opportunities under the Inflation Reduction Act, the Infrastructure Investment and Jobs Act or the Justice 40 initiative, to assist with resilience planning and preparation.
The climate vulnerability index pulls publicly available data from sources like the American Community Survey, National Institute of Health, Intergovernmental Panel on Climate Change and research organizations like First Street Foundation, among others. It will be updated regularly to reflect the latest advancements in new and existing data sources, according to the site.


